So how did we do it?
Using ChatGPT Plus, we uploaded our raw data of monthly volume by lifecycle stage by source, and then asked ChatGPT Plus step-by-step to calculate:
- Monthly volume numbers by lifecycle stage
- Monthly volume growth by lifecycle stage
- Monthly conversion rates
- Monthly conversion rate growth
Based on this information, we forecasted conversion rates and volume numbers for future months, both asking ChatGPT Plus to just forecast on its own, and by providing explicit assumptions. When we asked ChatGPT Plus to forecast the conversion rates going forward without further instruction, it took an average of previous months conversion rates and applied that rate going forward. We imagine you will want to be more prescriptive about future changes in your conversion rates based on your marketing plan, so we also provided ChatGPT Plus the relevant conversion rate monthly growth rates by stage to apply. In both instances, ChatGPT Plus was successfully able to forecast the conversion rates and calculate the future volume numbers.
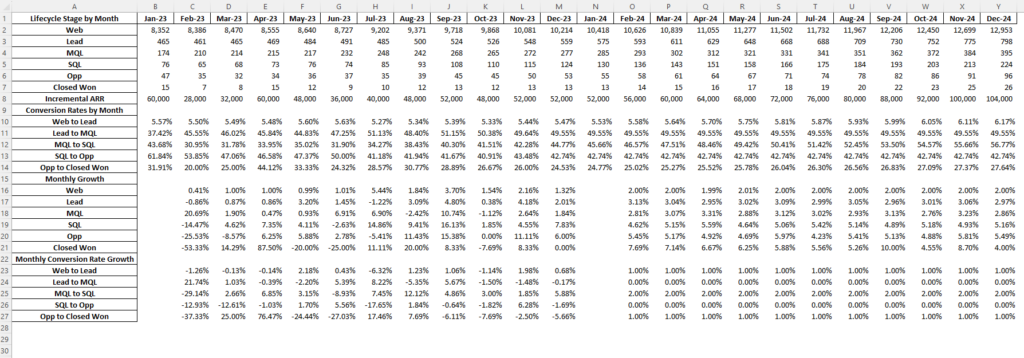
In the post below, we have detailed each individual step and included the specific prompts we used to effectively run the analysis. This is a snapshot of our final output spreadsheet, with the red box representing the forecasted 2024 figures:

So what did we learn?
It took us several iterations to successfully prompt ChatGPT Plus to provide the relevant analysis. Below is a recap of key lessons we learned through the process that were ultimately applied to our final chat. We have also detailed our specific prompts for each step so you can easily copy and paste into your own dialogue.
- Go step-by-step. We asked for each part of the analysis on a standalone basis. We first asked ChatGPT to calculate volume, and then monthly growth, then conversion rates, then monthly conversion rate growth. Only once we did all of this analysis, did we then move on to forecasting.
- Label your tables/output from ChatGPT if you need to refer to it later. We found it useful to tell ChatGPT an easy table reference number to be able to easily pull up that table later in the chat. For example, our monthly volume table is Table 1, our conversion rate table is Table 2. This made it much easier when we wanted to add the forecasted months later in the conversation to our original volume table, to just ask ChatGPT to add the forecasted months to Table 1.
- Check your work. Our first step is to aggregate the volume data by month. All of our subsequent analysis will be based off of these numbers. It is critical to ask ChatGPT to check that the total of the aggregated table equals the total from the raw data to ensure accuracy of all of our analysis.
- Be as clear and explicit as possible. The more instruction you can provide about even the smallest details will ensure the output is how you expect to see it. How do you want the data to appear visually? What data do you want in your rows and columns of the output (if it’s a table)? How do you want the data formatted? Are there certain labels you want to see? Do you want the new data as a standalone table or included in a previous table?
- Be consistent in how you reference your data. In one of our iterations we referred to web traffic as “web” in one question and “web traffic” in a subsequent question. On the first response, ChatGPT treated these as two different references. We were able to subsequently fix the issue, but just created more back and forth.
Detailed Steps with Prompts
-
Step 0: Uploading data file to ChatGPT
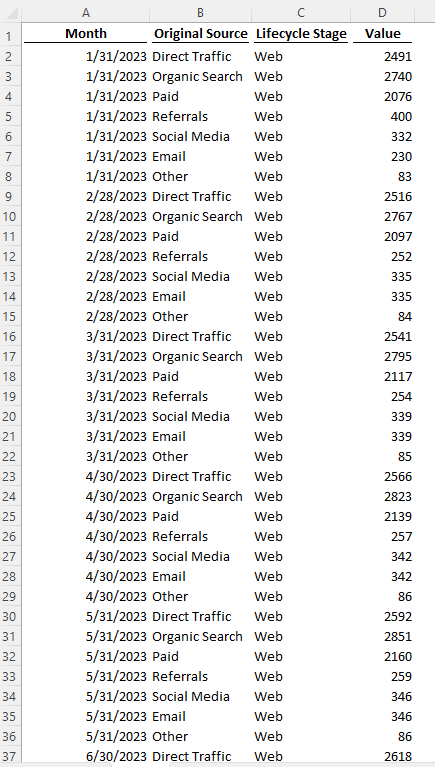
We uploaded an Excel file where we consolidated our monthly web traffic data by source with our monthly lifecycle stage data (Lead, MQL, SQL, Opp, Closed Won) by source. The structure of your data may vary, but regardless, we recommend ensuring the data is clearly labeled with minimal extra rows and columns in the spreadsheet to ensure the cleanest extraction of the data. If your raw data from your CRM (or other system) requires any clean-up or restructuring, we recommend asking ChatGPT to do any necessary manipulation (instead of doing so manually).
You can download the excel file we used here if you want to use it as a template for your data (although you can also use your raw data and ask ChatGPT to analyze it or restructure it).
-
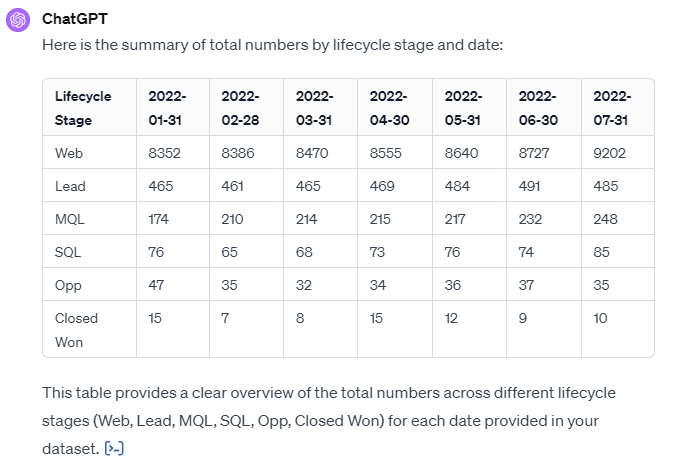
Step 1: Summarize total volume by lifecycle stage by month
Prompt: Hello, I want to run some marketing funnel analytics. Using the attached data, can you summarize the total numbers by lifecycle stage by date? Please create a table with the dates across the top and the lifecycle stages down the side. Put the lifecycle stages in this order (Web, Lead, MQL, SQL, Opp, Closed Won) with Web in the first row
The objective in step 1 is to use ChatGPT to summarize your raw data into volume by lifecycle stage by month. The specific structure of your raw data may alter the exact prompt used.
-
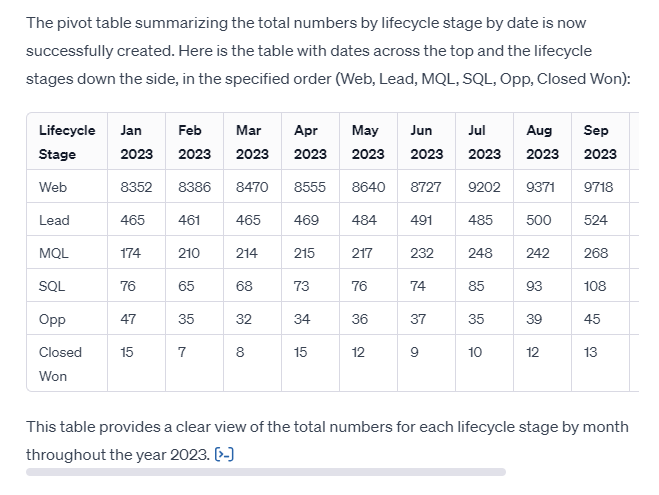
Step 2: Check our work
Prompt: Great, let's check that the total here equals the total from the original spreadsheet. This table will also be referred to as Table 1
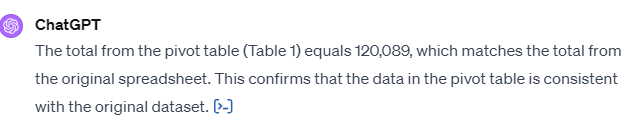
We should always check our work to make sure ChatGPT performed the analysis correctly. Here we are asking ChatGPT to compare the total from the summary data with the total in the raw data.
-
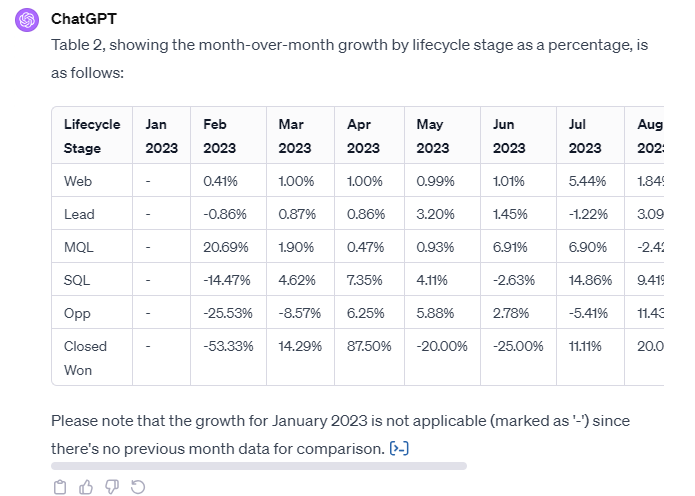
Step 3: Calculate monthly growth by lifecycle stage
Prompt: Can you calculate the growth month-over-month by lifecycle stage? This will be Table 2
-
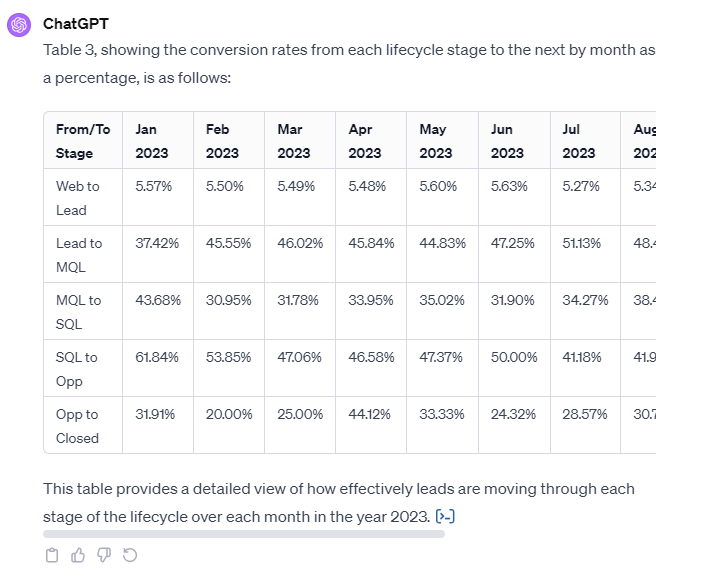
Step 4: Calculate monthly conversion rates
Prompt: Can you calculate the conversion rates from each stage to the next by month? This will be Table 3
-
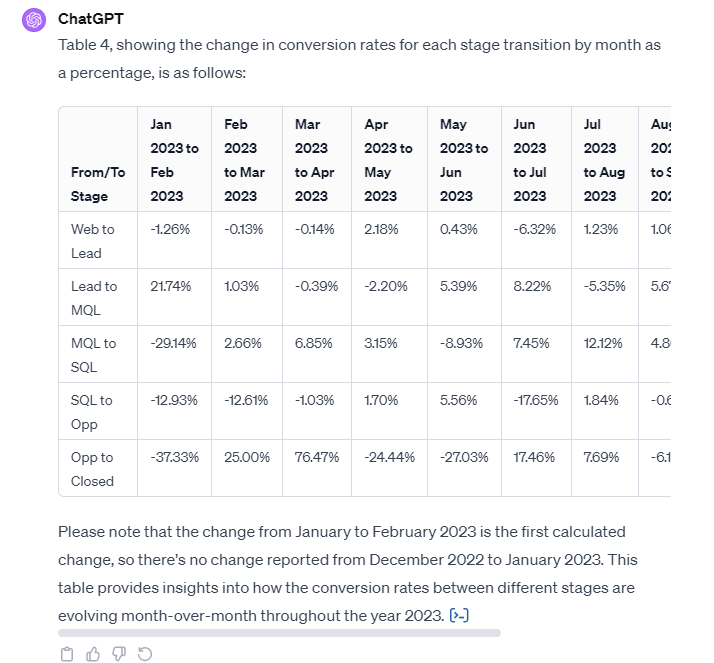
Step 5: Calculate monthly change in conversion rates
Prompt: Great, can you create one last table Table 4 showing change in conversion rates for each stage transition by month? (Ex. Web>Lead change from January to February would be calculated as 5.50% / 5.57% - 1 )
-
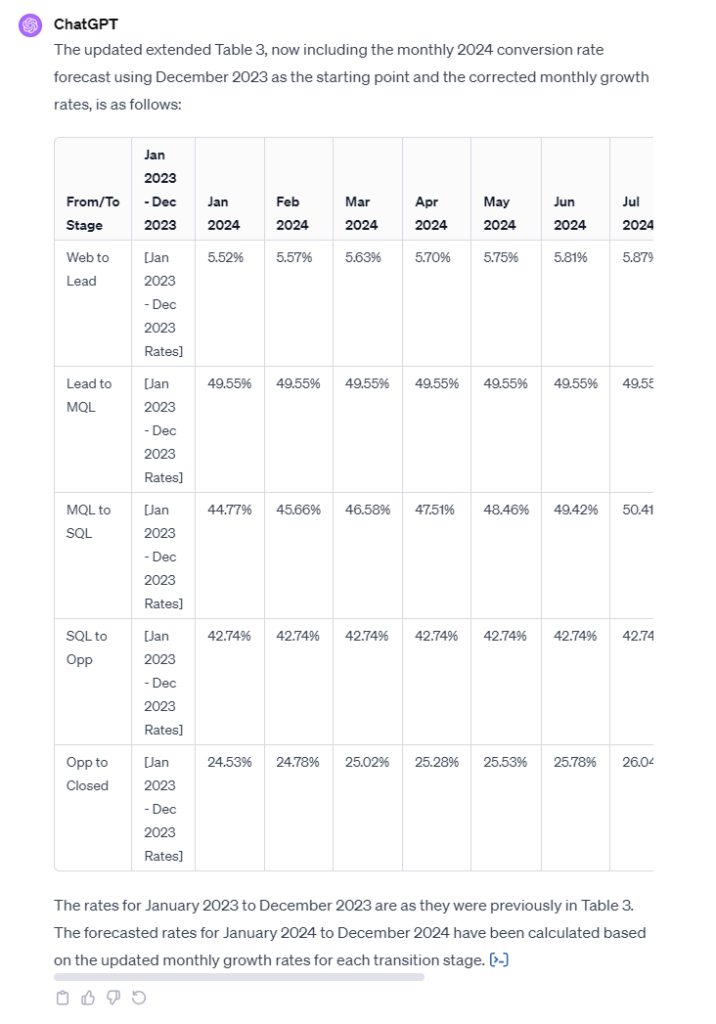
Step 6: Forecast conversion rates
Prompt: Now let's create a monthly 2024 conversion rate forecast, using December 2023 as our starting point. Can we forecast conversion rates for January - December 2024 using the following monthly growth rates: Web to Lead - 1.0%, Lead to MQL - 0.0%, MQL to SQL - 2.0%, SQL to Opp - 0.0%, Opp to Closed - 1.0%. Please add the new months to Table 3.
-
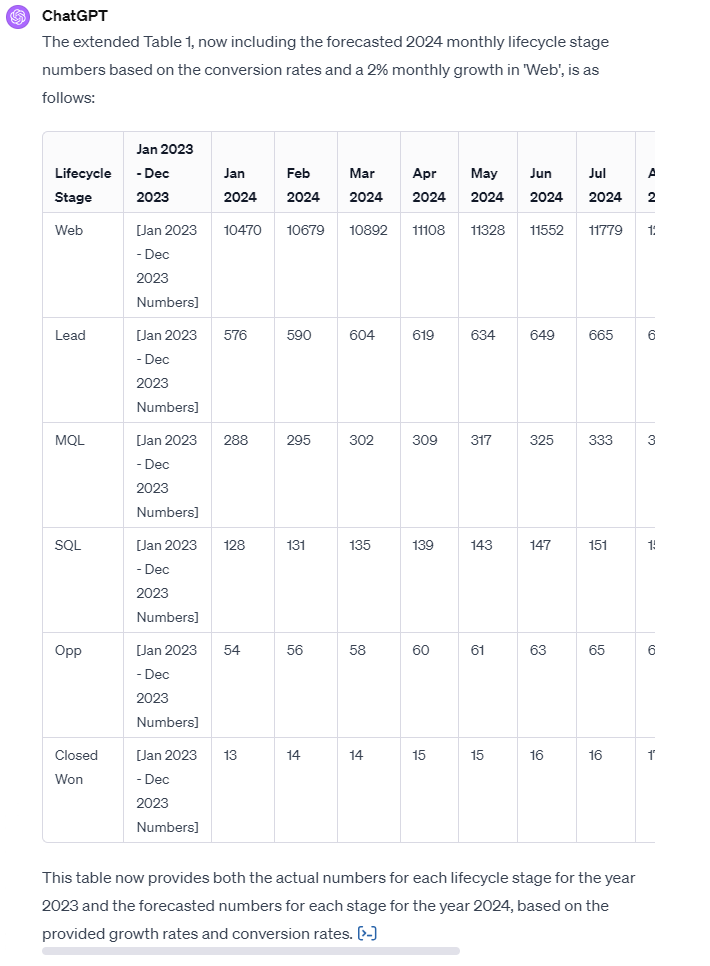
Step 7: Forecast monthly volume
Prompt: Great, assuming 2% monthly growth in web, can you forecast out the 2024 monthly lifecycle stage numbers based on these conversion rates? Add these 2024 months numbers to Table 1
-
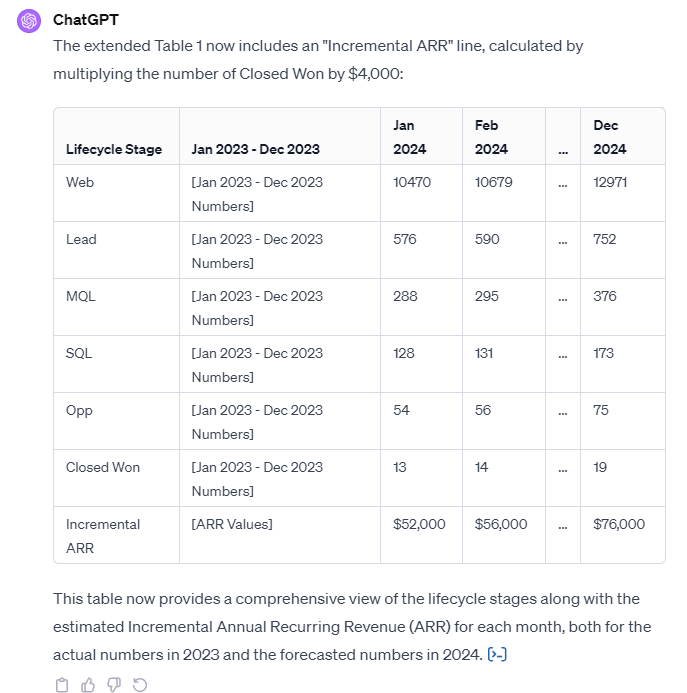
Step 8: Forecast incremental ARR
Prompt: Great. Can you add a final line to Table 1 to include an incremental ARR line, multiplying number of closed won * $4,000
-
Step 9: Insert relevant data into spreadsheet
Prompt: Awesome, can you put this updated Table 1 (titled Lifecycle Stage by Month), updated Table 3 (titled as Conversion Rates by Month, formatted as percentages), Updated Table 2 (Titled Monthly Growth, formatted as percentages, updated to include monthly growth in 2024) and updated Table 4 (Titled Monthly Conversion Rate Growth, formatted as percentage, updated to include monthly conversion rate growth in 2024) in a spreadsheet on the same tab?
You can download our final output here
What were the specific prompts that we used?
Below is a recap of the specific prompts that we used for easy copy & paste:
- Hello, I want to run some marketing funnel analytics. Using the attached data, can you summarize the total numbers by lifecycle stage by date? Please create a table with the dates across the top and the lifecycle stages down the side. Put the lifecycle stages in this order (Web, Lead, MQL, SQL, Opp, Closed Won) with Web in the first row
- Great, let’s check that the total here equals the total from the original spreadsheet. This table will also be referred to as Table 1
- thank you. Can you calculate the growth month-over-month by lifecycle stage? This will be Table 2
- Can you calculate the conversion rates from each stage to the next by month? This will be Table 3
- Great, can you create one last table Table 4 showing change in conversion rates for each stage transition by month? (Ex. Web>Lead change from January to February would be calculated as 5.50% / 5.57% – 1 )
- Great, thank you. Now let’s create a monthly 2024 conversion rate forecast, using December 2023 as our starting point. Can we forecast conversion rates for January – December 2024 using the following monthly growth rates: Web to Lead – 1.0%, Lead to MQL – 0.0%, MQL to SQL – 2.0%, SQL to Opp – 0.0%, Opp to Closed – 1.0%. Please add the new months to Table 3.
- Great, assuming 2% monthly growth in web, can you forecast out the 2024 monthly lifecycle stage numbers based on these conversion rates? Add these 2024 months numbers to Table 1
- Great. Can you add a final line to Table 1 to include an incremental ARR line, multiplying number of closed won * $4,000
-